
Analytics Basics
Getting started with summary statistics

Data analysis is about finding insights in data. An “insight” generally refers to a trend, pattern or characteristic within a data set. We all have experiences of identify patterns in real life, and these can sometimes serve as our hypotheses when we are analyzing data.
For example, you may notice that public transit is busiest on weekday mornings and after work hours (this makes sense, since usually people are commuting to and from work or school at these times). Or that the first heavy snow fall of the year typically causes delivery delays (since roads are not yet plowed). Or perhaps that traffic to cottage country is always heaviest on long weekends. Data analysis is about finding and codifying these patterns so we can make better decisions to address them. For example, if we know which areas of the city and which points of the day have the most public transit commuters, perhaps we can deploy more frequent streetcars or buses. If we can anticipate snowfall a week in advance, we can contract snowplows to clear snowfall and prevent delivery delays.
Analytics in Business
Before we dive into using analytics in business, let’s consider how a business works. Businesses typically sell a product or service for a price, which gives them revenue. The will also have costs (e.g., employee salaries, manufacturing and logistics) to create and deliver their product or service to customers.
A business executive may have various questions that can be answered with analytics. For example:
How much revenue did we make last month?
Which spend category was the biggest driver of cost for the year?
Which product was the most profitable in the last quarter?
The answers to these questions are examples of descriptive analytics. We can use data to calculate baseline metrics and answer the question of “what happened?” within a given timeframe, consumer segment, or product. We generally see this type of high level analysis in dashboards and reports. Dashboards and reports can be created using tools like MS Excel, Google Sheets, Tableau, or Power BI.
Of course, metrics only tell part of the story. They don’t really answer the question of “why did something happen?” We need diagnostic analytics to dive deeper into a problem and find actionable insights. For example, suppose we worked in the automotive industry and we saw through reports that gas cars were more popular than electric cars in the last quarter. Our follow-up questions might be:
Could cheaper gas prices be a driver for consumers selecting gas over electric cars?
Were there special promotions taking place on gas vs electric cars?
Were incentives to buy electric cars reduced over the last quarter?
In this example, we are asking specific questions about why one product was more popular than another. In other words, we are creating hypotheses that we could answer using analytical techniques. Once we know the reason for gas cars being more popular than electric cars, as a business we could take appropriate measures to influence consumer behaviour in the future - for example, by creating competitive promotions for electric cars.
Using advanced analytics, we could take this a step further and answer more complex questions - for example, if gas prices increase, what is the product mix that we expect to sell between electric vs gas cars? Are we likely to see greater electric car sales? This is an example of predictive analytics. This area of analytics allows us to model various scenarios to anticipate what might happen in the future should certain changes take place. In statistical terms, we may think of this as inputs and outputs. If we manipulate certain inputs (e.g., gas prices), what will the impact on the output (e.g., electric car sales) be?
By now you should notice that as we ask deeper questions, we can use analytics to get more relevant answers and make better business decisions. In some cases, when we understand a problem really well, we could even use analytics to automate the decision making process. For example, if we were trying to optimize our gas vs electric car promotions such that we maximize revenue, we could ask:
What is the optimal amount of discounts we should offer on electric vs gas cars simultaneously to maximize sales?
When should we launch electric car special offers?
In which dealerships should we continue to prioritize gas cars?
The answers to these questions are examples of prescriptive analytics. This is the most advanced area of analytics, as we are training a machine how to make decisions and relying on the machine to make the best decision possible for the business. While I would like to say this is an “unbiased” decision, this wouldn’t technically be true - more on that later.
Formulating a Business Problem
Business stakeholders will often ask simple questions, like “how much revenue did we make from electric cars last month, and what was the average gas price for the month?” As an analyst or data scientist, your job is to dig deeper and uncover more interesting problems to solve. This is where the true power of analytics comes to light. We should always aim to use diagnostic analytics at least, and if we have the opportunity to build a predictive model for scenario analysis, that’s even better.
An important part of being a good analyst is being able to ask good follow-up questions. Some examples of questions I usually consider to inform my analysis are:
What is the main problem we are looking to solve (i.e., is the stakeholder asking because we need to boost revenue or cut costs?)
Is this an immediate, one-time analysis to provide instant insight, or a long-term strategic question (i.e., opportunity for predictive analytics)?
What is the decision we are trying to make?
How is this decision made today?
Once you have some answers, you can consider the level of complexity your analysis requires, the data requirements, and potential techniques to use.
Descriptive Statistics
We will always start any analysis with some descriptive statistics - this gives us a sense of what the data looks like. Descriptive or summary statistics include:
Mean
Median
Mode
Range
Variance
Standard Deviation
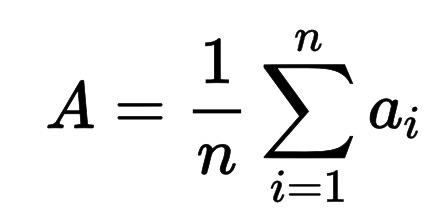
The mean tells use the average of a set of numbers. We calculate the average by adding up all the numbers and dividing by the number of numbers we are given. For example, suppose we had the following test scores:
[100, 98, 56, 75, 87, 76, 65, 90]
There are 8 numbers in the list; if we add them up, we get:
= 100 + 98 + 56 + 75 +87 +76 + 65 + 90
= 647
Then divide by 8:
= 647 / 80
= 80.88 or 81 (rounded)
The mathematical notation for the mean is:
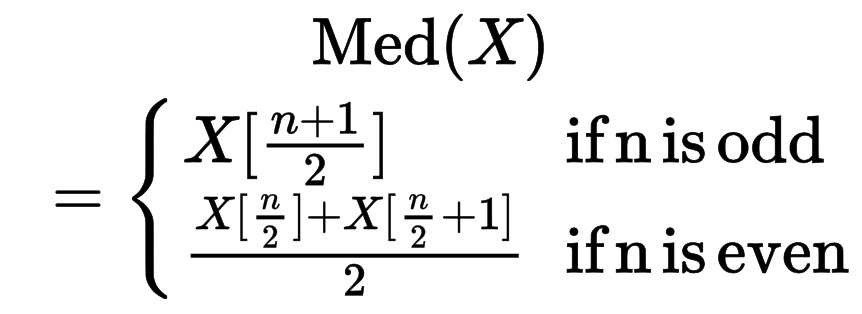
The median tells us the number in the middle. We should always organize numbers from smallest to largest, then if we have an odd count of numbers, we can identify the number directly in the middle. If we have an even count of numbers, we need to find the two numbers directly in the middle and calculate the average. In our example:
Original list = [100, 98, 56, 75, 87, 76, 65, 90]
Re-ordered lists = [56, 65, 75, 76, 87, 90, 98, 100]
Two numbers in the middle = [76, 87]
Average of middle numbers = (76 + 87) / 2
Median = 81.5
The mathematical notation for the mean can be represented by:
The mode tells us the most frequently occurring number. In a simple example of a list, we would organize the data from smallest to largest, identify repeated values, and find the number which is repeated the most times. For categorical data, the mode is a useful measure. For continuous data, we typically use the mean and the median.
Collectively, the mean, median and mode are measures of central tendency. This means that we are trying to find a single value which is somewhere in the middle, to tell us about the data we are working with. For example, suppose we owned a clothing business and we saw that the average number of items a customer purchased was 3. This tells us something useful - if we are a high margin business (i.e., our clothes don’t cost us very much to make, but we sell them for a high price), then this is probably a great number to see. However, if we are a low margin business and people are only buying 3 pieces at a time, then we need to find a way to increase this number. Of course, business decisions are much more complex than this - but these metrics can give us a general indication of our performance.
The range of a data set can be calculated by subtracting the minimum value from the maximum value. In our example, this would mean:
Test scores = [56, 65, 75, 76, 87, 90, 98, 100]
Maximum value = 100
Minimum value = 56
Range = 100 - 56
Range = 44
This is an example of spread or dispersion. The spread can inform our approach to analyzing data and using the results to make decisions. However, the range can be misleading. Some data sets have outliers. Outliers are data points which are significantly further away than the rest of the data, and have a low frequency of occurrence. For example, if most of the test scores were between 70-80, but one person scored 20, this single data point may influence our conclusions even though it is not a common result. We may conclude that students need easier tests or more support, even though most students actually scored fairly well. The range metric is useful to get a sense of data dispersion, however we should approach it with caution and dig further.
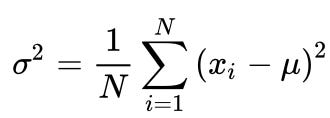
Another measure of dispersion is the variance. The variance takes into consideration the mean (or centre) of the data set, and measures how far away from the mean the remaining data points are. The variance is a much better measure for understanding spread, because it takes into account the frequency. It is calculated by taking the difference between each data point and the mean, squaring it, and then calculating the average distance. Thus, points which are really far away (e.g., outliers) won’t have as much of an influence on the overall result. The formula for variance is given by:
Let’s calculate the variance of our test scores.
Test scores = [56, 65, 75, 76, 87, 90, 98, 100]
Mean = 81
Variance = ((56-81)^2 + (65-81)^2 + (75-81)^2 + (76-81)^2 + (87-81)^2 + (90-81)^2 + (98-81)^2 + (100-81)^2) / (8-1)
Variance = (619 + 252 + 35 + 24 + 37 + 83 + 293 + 365) / 7
Variance = 244
There is no right or wrong answer on what the variance should be, but the variance can tell us a lot about the data set. Whether the variance is good or bad depends on the problem we are solving for. For example, if we are teachers, we would like most students’ grades to land somewhere around the average. This could indicate that their knowledge and skills are fairly similar, and from a teacher’s point of view, this would indicate that the teacher was effective in delivering the required material.
In a different scenario, if we worked at Walmart where product prices range from $0.50 to $5,000+ and we calculated the variance of purchases, it would make sense that the variance is very high since there is a wide variety of products and prices, and customers are looking for different things.
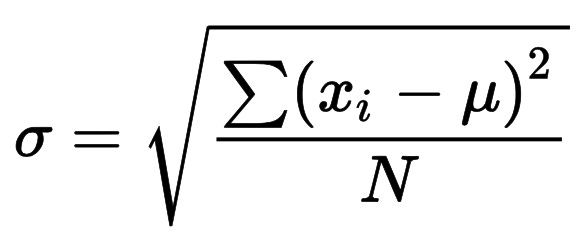
While we use variance for a number of statistical analyses, you will notice that this number seems somewhat abstract, in that our test scores range from 56 to 100, while the variance is 244 - nowhere in the known range! That’s because we squared all values to remove the impact of the negatives (i.e., 56-81 = -25, where as 100-81 = 19, if we simply add these numbers up, they will mostly cancel each other out). To bring the metric back into relatable units, we can calculate the standard deviation. To do this, we can simply take the square root of the variance.
In our case, this means:
St Dev = SqRt(244)
St Dev = 16
We interpret this as: while the average score in the class was 81, most students landed + or - 16 points. Thus, most students scored between (81 - 16) and (81 + 16), or 65 and 97.
Review
Ultimately, summary statistics (or descriptive statistics) tell us some information about the data set we are working with. When we are analyzing data, we will typically calculate these metrics for the full data set first, and then for sub-segments of the data (for example, we can isolate specific groups or categories).
The main objective of summary statistics is to understand central tendency and dispersion of the data. We can then interpret what this means in relation to our problem, and identify the next steps in our analysis.